Artificial Intelligence, zBlog
AI ROI Framework: How to Measure, Prove, and Scale AI Returns Across the Enterprise
trantorindia | Updated: April 15, 2026
Enterprise AI spending reached $644 billion in 2025, yet 95 percent of generative AI pilots fail to deliver measurable P&L returns. Only 25 percent of AI initiatives deliver expected ROI, and 42 percent of companies abandoned most of their AI projects in 2025 — up from 17 percent the prior year. The problem is not AI capability. It is measurement. Most organizations track adoption when they should be tracking business outcomes. This guide provides a four-layer AI ROI framework that connects AI activity to financial impact, along with industry benchmarks, the five metrics CFOs actually care about, the common measurement mistakes that kill promising initiatives, and a phased approach to scaling returns from pilot to enterprise-wide deployment.
Why Is AI ROI So Difficult to Measure?
AI ROI is difficult to measure because AI does not follow the linear cost-benefit patterns that traditional enterprise technology does. Understanding why conventional ROI frameworks break down is the first step to building ones that work.
Traditional IT follows a predictable arc. You implement a system, digitize a process, and efficiency gains appear within 7 to 12 months. The returns are linear, measurable, and relatively easy to isolate. AI does not work this way. Most organizations achieve satisfactory returns within 2 to 4 years — three to four times longer than conventional technology deployments. Only 6 percent see payoff in under a year. Even among the most successful implementations, just 13 percent deliver payback within 12 months.
The formula itself is the first problem. In traditional finance, ROI is straightforward: net profit divided by investment cost, expressed as a percentage. Apply that formula to AI, and it falls apart almost immediately, because AI creates multiple types of value — productivity gains, error reduction, faster decisions, new capabilities, risk mitigation, customer experience improvements — many of which are difficult to isolate, attribute, and express in dollar terms.
The measurement gap is not academic. It has real consequences.
An IBM CEO study found that only 25 percent of AI initiatives deliver expected ROI, just 16 percent have scaled enterprise-wide, and CEOs are balancing pressure for short-term returns with longer-term innovation goals. S&P Global data shows the share of companies abandoning most of their AI projects jumped to 42 percent in 2025, up from 17 percent the year prior, citing total cost and unclear value as top reasons. More than half of finance executives cannot clearly demonstrate ROI from their AI investments.
The failure is not in AI’s capability to deliver value. The failure is in how organizations define, measure, and communicate that value.
What Does the Data Actually Say About AI Returns?
Before building a measurement framework, it helps to understand what the best-performing organizations are actually achieving — because the data reveals a stark divide between leaders and laggards.
The Leader-Laggard Gap Is Widening
BCG’s 2025 “Widening AI Value Gap” report, based on a global survey of 1,250 senior executives, found that only 5 percent of companies qualify as “future-built” for AI — systematically building capabilities across functions and consistently generating substantial value. These leaders show 1.7x revenue growth, 3.6x three-year Total Shareholder Return (TSR), 2.7x return on invested capital, and 1.6x EBIT margin compared to laggards. Another 35 percent are scaling AI and beginning to generate value. The remaining 60 percent generate no material value despite investments.
McKinsey’s State of AI 2025 confirms the pattern: 88 percent of companies use AI in at least one function, but only 39 percent see an impact on EBIT — and most report impact of less than 5 percent. Only 32 percent are in the scaling phase. Seven percent are fully scaled.
The performance gap between leaders and laggards is not about access to better models or larger budgets. It is about five structural factors: strategic alignment (deploying AI where it delivers actual impact), workflow redesign (not just layering AI on existing processes), production deployment (moving past pilots), organizational capability (talent, governance, data), and measurement discipline (tracking outcomes, not activity).
Industry Benchmarks for AI ROI
The returns vary significantly by industry and use case, but concrete benchmarks are emerging.
Financial services leads with 4.2x ROI on generative AI, with AI-driven KYC/AML compliance reducing onboarding costs by up to 30 percent, and efficiency gains ranging from 35 to 50 percent.
Customer operations show 30 to 45 percent productivity gains from applying generative AI, translating to shorter handle times and higher first-contact resolution.
Supply chain and procurement report 26 to 31 percent cost savings across functions.
Marketing and personalization deliver 5 to 15 percent revenue lifts and 10 to 30 percent marketing ROI gains for organizations that get personalization right.
Manufacturing shows 20 percent reduction in downtime costs through predictive maintenance and 15 to 25 percent defect rate reduction through computer vision quality inspection.
Fraud prevention demonstrates concrete impact: the UK Cabinet Office reported £480 million prevented or recovered between April 2024 and April 2025 through AI-driven fraud tooling.
The pattern is clear: AI delivers measurable returns in specific use cases with well-defined inputs, outputs, and success criteria. The organizations that struggle are those measuring AI’s impact at the enterprise level without connecting it to specific business outcomes.
The Four-Layer AI ROI Framework

Most AI ROI failures happen because organizations measure the wrong things at the wrong level. This framework provides four measurement layers, each building on the previous one, that connect AI activity to financial impact.
Layer 1: Utilization — Are People Actually Using AI?
Before measuring value, you need to confirm that AI tools are being used. This sounds obvious, but 72 percent of AI investments destroy value through waste, according to the Larridin State of Enterprise AI 2025 Report. Much of that waste comes from tools that are purchased but underutilized.
Metrics at this layer:
- Daily and weekly active users as a percentage of licensed users
- Feature utilization rates (which AI capabilities are being used, which are ignored)
- Frequency and depth of usage (one-off experiments vs. integrated into daily workflows)
- Shadow AI prevalence (how many employees are using unapproved AI tools)
The utilization layer is necessary but insufficient. High adoption does not prove value. An organization where 80 percent of employees use AI daily but produce no measurable improvement is spending money on activity, not outcomes.
Layer 2: Productivity — Is AI Making Work Faster or Better?
The productivity layer measures whether AI usage translates into work being done faster, with higher quality, or with greater throughput. This is where most organizations stop — and it is where the measurement gap begins.
Metrics at this layer:
- Time savings per task (hours saved on document review, research, drafting, analysis)
- Throughput increase (more matters handled, more tickets resolved, more deals processed)
- Error reduction (fewer defects, fewer rework cycles, fewer compliance violations)
- Quality improvement (better accuracy, more thorough analysis, higher customer satisfaction)
The challenge: productivity metrics are seductive because they are easy to collect and easy to present. But they do not answer the question that CFOs and boards are asking, which is “How does this affect the P&L?”
KPMG research shows investor pressure for demonstrating AI ROI intensified dramatically — from 68 percent in Q4 2024 to 90 percent in Q1 2025. Investors and boards do not want to hear that employees save four hours a week. They want to know what those saved hours produced in revenue, margin, or risk reduction.
Layer 3: Business Outcomes — Is AI Moving Financial Metrics?
The business outcomes layer connects AI-driven productivity to specific financial and operational metrics that the organization tracks at the executive and board level.
Metrics at this layer:
- Revenue impact (new revenue generated, revenue protected, customer lifetime value increased)
- Cost reduction (operational costs reduced, headcount avoided, error-related costs eliminated)
- Risk mitigation (fraud losses prevented, compliance penalties avoided, security incidents contained)
- Customer experience (NPS improvement, churn reduction, satisfaction score increases)
- Cycle time compression (time-to-market accelerated, decision speed improved, deal velocity increased)
This layer requires attribution — connecting AI’s contribution to business outcomes that are influenced by multiple factors simultaneously. A 15 percent increase in customer retention might be partly attributable to AI-powered personalization, partly to product improvements, and partly to market conditions. The discipline of isolating AI’s contribution — through A/B testing, controlled rollouts, and before-after comparisons with baselines — is what separates rigorous measurement from anecdote.
The Futurum Group’s 1H 2026 survey documented this shift in what enterprise buyers measure: direct financial impact (combining revenue growth and profitability) nearly doubled to 21.7 percent as the primary ROI metric, while productivity gains fell from 23.8 percent to 18 percent. The market is moving from Layer 2 to Layer 3 measurement.
Layer 4: Strategic Value — Is AI Creating Competitive Advantage?
The strategic value layer captures AI’s impact on capabilities that determine long-term competitive position — but that resist short-term financial quantification.
Metrics at this layer:
- Time-to-market for new products and features
- Organizational learning speed (how fast the organization adapts to new information)
- Innovation pipeline health (new capabilities enabled by AI that were previously impossible)
- Talent attraction and retention (ability to attract engineers and knowledge workers)
- Data asset appreciation (the compounding value of proprietary datasets that improve with use)
Strategic value is the hardest to measure but often the most important. Jensen Huang argued that demanding immediate ROI from AI is “like forcing a child to make a business plan.” While the analogy may frustrate CFOs, the underlying point is valid: some AI investments create capabilities that generate returns over years, not quarters. The framework must have space for this — while also ensuring that “strategic value” does not become a hiding place for initiatives that simply cannot demonstrate results.
The Five Metrics CFOs Actually Care About
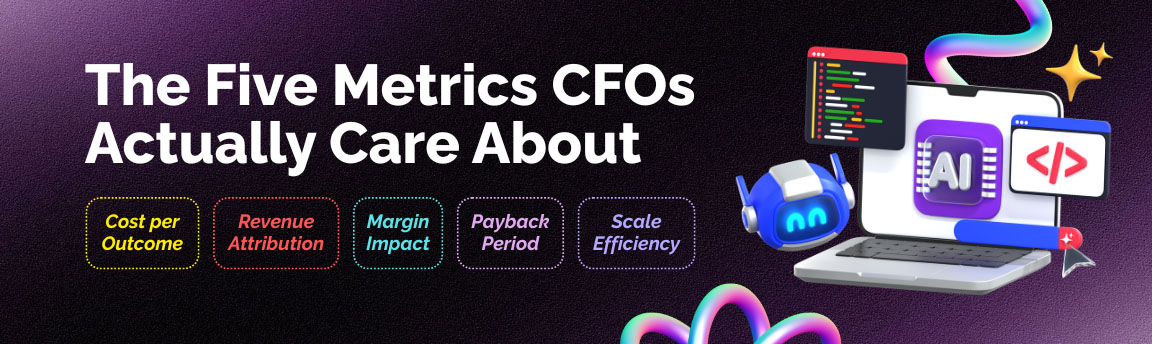
CFOs do not care about model accuracy, inference latency, or prompt engineering quality. They care about metrics that connect to financial statements and board conversations. Here are the five that matter most.
1. Cost per Outcome
Not cost per API call. Not cost per model inference. Cost per business outcome achieved. How much does it cost to resolve a customer inquiry using AI versus a human agent? How much does it cost to review a contract using AI-assisted workflow versus traditional review? This metric makes AI economics tangible and comparable to existing operational benchmarks.
2. Revenue Attribution
What revenue can be directly or partially attributed to AI-driven capabilities? This includes revenue from AI-powered product features, revenue protected through AI-driven retention, and revenue generated through AI-enabled personalization or pricing optimization. Attribution requires controlled measurement (A/B testing, holdout groups) — not post-hoc correlation.
3. Margin Impact
AI should improve margins through some combination of cost reduction, productivity gain, and pricing optimization. Track gross margin and EBIT margin for business units or functions where AI is deployed, compared to pre-deployment baselines and comparable units without AI.
4. Payback Period
How long from initial investment to measurable positive returns? Most organizations see satisfactory returns within 2 to 4 years for AI initiatives. Leaders achieve 9 to 12 months instead of the 12 to 18 months typical of laggards. Track payback period by initiative type to inform future investment decisions.
5. Scale Efficiency
As AI initiatives scale from pilot to enterprise-wide deployment, does cost per outcome decrease? Does value per user increase? Scaling efficiency measures whether the economics improve with scale — which they should, because AI systems learn, data compounds, and fixed costs are amortized across more use cases. If scaling increases cost per outcome, the initiative has a structural problem.
Why AI Projects Get Killed: The Five Measurement Mistakes

Most AI projects are terminated not because they fail to create value, but because nobody can prove they succeeded. Here are the five measurement mistakes that destroy promising initiatives.
Mistake 1: No Baseline
Without pre-AI performance benchmarks, attribution is impossible. You cannot prove improvement when you never documented the starting point. Organizations that skip baseline measurement spend more effort retroactively constructing baselines than the original measurement would have cost.
Fix: Before deploying any AI initiative, measure the current state of every metric you intend to improve. Document processing times, error rates, costs per outcome, throughput, and quality scores for at least three months before launch.
Mistake 2: Wrong KPIs
Optimizing for model accuracy when business leaders care about dollars saved creates a credibility gap. Technical success that does not translate to business language means perceived failure — even when the technology is working.
Fix: Define KPIs in business language from day one. Not “94 percent accuracy on fraud detection” but “$3.2 million in fraudulent transactions prevented last quarter with 35 percent fewer false positives.”
Mistake 3: One-Time Measurement
Treating ROI as a post-launch report rather than a continuous process misses the compounding value trajectory. AI systems improve over time as they process more data and as organizations learn to use them more effectively. A one-time measurement at launch captures the worst performance the system will ever deliver.
Fix: Implement continuous measurement with monthly tracking and quarterly reporting. Show the trajectory, not just a snapshot.
Mistake 4: Platform-Specific Definitions
Each AI platform defines metrics differently. Usage statistics from one tool are not comparable to another. Without normalization, you cannot aggregate AI ROI across the organization or compare the return on different investments.
Fix: Define organization-wide metrics that are platform-independent. Measure outcomes (time saved, costs reduced, revenue generated) rather than platform-specific activity metrics (prompts generated, tokens consumed).
Mistake 5: Measuring AI in Isolation
AI delivers most of its value when combined with workflow redesign, process improvement, and organizational change. Measuring AI’s contribution in isolation from these complementary investments understates the total return of the program while making AI look like it failed to justify its cost.
Fix: Measure the combined return of the transformation program (AI + process change + training), then use controlled experiments to estimate AI’s marginal contribution within the bundle.
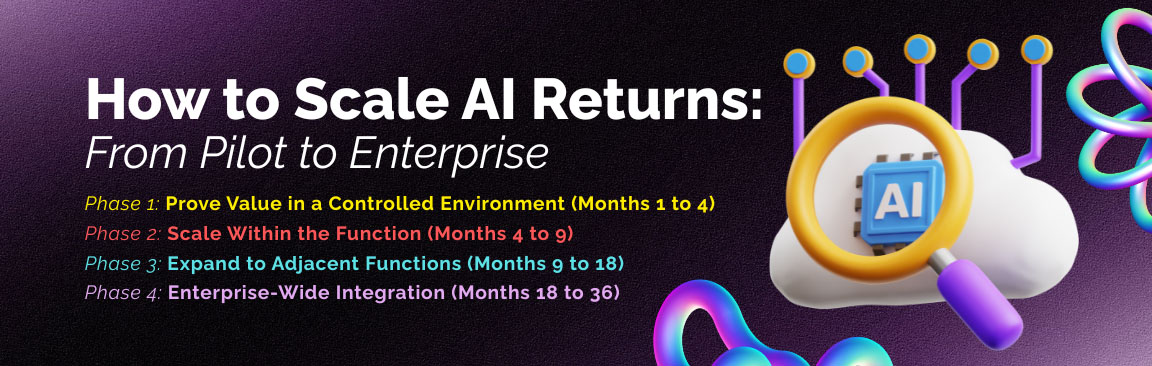
How to Scale AI Returns: From Pilot to Enterprise
The path from successful pilot to enterprise-wide AI returns is where most organizations stall. BCG found that organizations average 4.3 pilots but only 21 percent reach production scale with measurable returns. Bridging this gap requires a deliberate scaling strategy.
Phase 1: Prove Value in a Controlled Environment (Months 1 to 4)
Select one to three high-impact use cases with clear, measurable baselines. Deploy AI in a controlled environment with A/B testing or before-after comparison. Measure Layer 1 (utilization) and Layer 2 (productivity) metrics weekly. Begin tracking Layer 3 (business outcomes) monthly. The goal is not to prove that AI works in general. It is to demonstrate measurable impact on a specific business metric in a specific context.
Success criteria: Statistically significant improvement in at least one business outcome metric. Clear understanding of cost per outcome. Documented learnings about what worked and what did not.
Phase 2: Scale Within the Function (Months 4 to 9)
Expand the successful use case across the full function — all teams, all geographies, all product lines within the original business area. This is where hidden scaling challenges emerge: data quality issues that did not appear at pilot scale, integration requirements with legacy systems, training needs for broader user populations, and governance requirements for wider deployment.
Success criteria: Consistent performance at scale. Declining cost per outcome as fixed costs are amortized. Positive Layer 3 metrics across the expanded deployment.
Phase 3: Expand to Adjacent Functions (Months 9 to 18)
Apply the proven AI capability to adjacent business functions that share similar characteristics. If AI-powered document review works for the legal team, explore applicability in compliance, procurement, and HR. If AI-driven customer insights work in marketing, extend to product development and sales.
Success criteria: Cross-functional deployment with measurable returns in each new area. An emerging AI capability platform that reduces the cost and time of each new deployment.
Phase 4: Enterprise-Wide Integration (Months 18 to 36)
At this stage, AI is no longer a project. It is infrastructure. The organization has moved from “we use AI for specific tasks” to “AI is embedded in how we operate.” Measurement shifts from individual initiative ROI to enterprise-wide metrics: AI-driven revenue as a percentage of total revenue, AI-enabled cost savings as a percentage of operating expenses, and competitive metrics that compare the organization’s AI maturity against industry benchmarks.
BCG’s research shows that future-built companies deploy 62 percent of AI initiatives to production (versus 12 percent for laggards) and achieve faster time-to-impact: 9 to 12 months instead of 12 to 18 months. They reach this by treating AI as a core operating capability, not a technology experiment.
The Organizational Requirements for AI ROI
Technology alone does not deliver AI returns. IBM’s Q4 2025 Think Circle identified the primary challenge: it is not a technology problem, but an organizational one. Culture, governance, workflow design, and data strategy are the main constraints on realizing ROI.
Executive Sponsorship Must Be Active, Not Performative
Nearly 100 percent of AI trailblazers report deeply engaged C-suites. Leaders who review AI metrics quarterly, remove organizational blockers, and hold teams accountable for outcomes drive fundamentally different results than leaders who approve budgets and walk away.
Workflow Redesign Is Non-Negotiable
Only 21 percent of organizations using GenAI have redesigned workflows from the ground up. The rest are layering AI on top of existing processes — which limits returns to incremental productivity gains rather than transformational impact. AI delivers maximum ROI when workflows are redesigned to leverage AI capabilities natively, not when AI is added as an afterthought to workflows designed for humans.
Data Strategy Precedes AI Strategy
AI is only as good as the data it operates on. Organizations with clean, integrated, governed data achieve measurably higher AI returns. Those with fragmented, low-quality, siloed data struggle regardless of how sophisticated their AI models are. The data foundation is not a prerequisite you can skip — it is the substrate that determines the ceiling of your AI ROI.
Governance Enables Scale, Not Constrains It
Without governance — clear policies for AI use, data handling, quality assurance, risk management, and ethical considerations — AI cannot scale beyond controlled pilots. Governance is what allows organizations to deploy AI confidently across functions, knowing that risks are managed and quality is maintained. The EU AI Act, phasing in since 2025, makes governance not just advisable but legally mandatory. ISO/IEC 42001 (AI management systems) is quickly becoming the governance backbone boards seek, with certification helping align with regulatory expectations and driving sustained ROI through repeatable practices.
How to Communicate AI ROI to the Board
The most technically sound AI ROI measurement is useless if it cannot be communicated in language that boards and investors understand. The communication challenge is distinct from the measurement challenge.
Lead With Business Outcomes, Not Technology Metrics
Boards do not care that your model achieved 94 percent accuracy. They care that the fraud detection system prevented $3.2 million in losses last quarter. Every AI ROI communication should lead with the business outcome — revenue generated, costs avoided, risks mitigated, customer satisfaction improved — and only reference technology metrics as supporting evidence.
Show the Trajectory, Not Just a Snapshot
AI investments compound over time. A quarterly ROI snapshot may show modest returns. A trajectory chart showing month-over-month improvement tells a fundamentally different story. Show the curve: initial investment, pilot results, scaling impact, and projected forward value. This is how leaders justify continued investment even when short-term numbers are modest.
Benchmark Against Alternatives
Every dollar spent on AI is a dollar not spent on something else. Frame AI ROI relative to alternative uses of the same capital. If $2 million invested in AI-driven customer service reduces handling costs by 30 percent, compare that to what $2 million in additional headcount, $2 million in process redesign without AI, or $2 million in competitor acquisition would have delivered. Relative ROI is often more persuasive than absolute ROI.
Quantify the Cost of Inaction
The most overlooked dimension of AI ROI is the cost of not investing. As competitors deploy AI-driven capabilities, the gap in efficiency, customer experience, and speed widens with every quarter of delay. BCG’s data shows the leader-laggard gap at 1.7x in revenue growth and 3.6x in Total Shareholder Return. For a board considering whether to continue AI investment, the competitive risk of stopping is often more compelling than the projected return of continuing.
Report Consistently Across Initiatives
Boards cannot evaluate AI as a portfolio investment if every initiative reports different metrics in different formats. Establish a standard AI ROI reporting template — covering utilization, productivity, business outcomes, and strategic value — that enables cross-initiative comparison and portfolio-level decision-making. Consistency builds credibility. Ad hoc reporting builds skepticism.
The Cost of Getting AI ROI Wrong
The consequences of poor AI ROI measurement extend beyond wasted investment.
Premature termination of valuable initiatives. When measurement frameworks fail to capture compounding value, promising AI projects get killed during the period when returns are just beginning to accelerate. The 42 percent abandonment rate in 2025 almost certainly includes initiatives that would have delivered significant returns if given another 6 to 12 months — but that lacked the measurement infrastructure to justify continued investment.
Misallocation of future investment. Without reliable ROI data, organizations cannot make informed decisions about where to invest next. Resources flow to the most politically powerful department or the most persuasive executive, rather than to the use cases with the highest measured returns. Over multiple investment cycles, this misallocation compounds into significant competitive disadvantage.
Erosion of organizational trust in AI. When AI projects are launched with bold promises and terminated with vague explanations, the organization develops AI fatigue — skepticism toward any AI initiative, regardless of its merit. Rebuilding organizational trust after a series of perceived failures is far more expensive than building rigorous measurement into the first initiative.
Regulatory and governance risk. As AI governance requirements tighten — EU AI Act, industry-specific regulations, board-level D&O liability — organizations that cannot demonstrate measured, documented AI outcomes face increasing compliance exposure. KPMG research found that 90 percent of organizations consider investor pressure for AI ROI demonstration important or very important. The inability to measure is rapidly becoming a governance failure, not just a management one.
Frequently Asked Questions
What is AI ROI?
AI ROI (Return on Investment) measures the financial and strategic returns generated by artificial intelligence investments relative to their total cost — including technology, infrastructure, talent, data preparation, change management, and ongoing operational expenses. Unlike traditional IT ROI, AI returns often compound over time, emerge across multiple dimensions (cost savings, revenue growth, risk reduction, capability creation), and require 2 to 4 years for full realization. Only 25 percent of AI initiatives currently deliver expected ROI, according to IBM.
Why do most AI projects fail to deliver ROI?
Most AI projects fail to demonstrate ROI not because the technology fails, but because of measurement failures. Common causes include no baseline measurement before deployment (making improvement impossible to prove), wrong KPIs (optimizing for technical metrics instead of business outcomes), one-time measurement (missing the compounding value trajectory), isolated measurement (not accounting for workflow redesign benefits), and pilot purgatory (organizations running 4.3 pilots on average but only 21 percent reaching production scale). The share of companies abandoning AI projects jumped from 17 percent to 42 percent between 2024 and 2025.
How long does it take to see AI ROI?
Most organizations achieve satisfactory returns within 2 to 4 years. Only 6 percent see payoff in under a year, and just 13 percent deliver payback within 12 months. However, AI leaders achieve faster returns — 9 to 12 months compared to 12 to 18 months for laggards — by strategically aligning AI to high-impact use cases, redesigning workflows, and deploying to production rather than remaining in pilot phase.
What AI ROI benchmarks exist by industry?
Financial services leads with 4.2x ROI and 35 to 50 percent efficiency gains. Customer operations shows 30 to 45 percent productivity gains from generative AI. Supply chain and procurement reports 26 to 31 percent cost savings. Marketing and personalization delivers 5 to 15 percent revenue lifts. Manufacturing shows 20 percent reduction in downtime through predictive maintenance. These benchmarks represent leader performance — most organizations achieve significantly lower returns until they move past pilot-phase deployment.
What metrics should CFOs track for AI ROI?
The five metrics CFOs care most about are cost per outcome (cost of achieving a business result using AI versus alternatives), revenue attribution (revenue directly or partially attributable to AI capabilities), margin impact (gross margin and EBIT improvement in AI-deployed functions), payback period (time from investment to measurable positive return), and scale efficiency (whether economics improve as deployment expands). These metrics connect AI performance to financial statements and board-level conversations.
How do you measure AI ROI when AI affects multiple outcomes?
Use a four-layer framework: Layer 1 measures utilization (are tools being used), Layer 2 measures productivity (is work faster or better), Layer 3 measures business outcomes (are financial metrics improving), and Layer 4 measures strategic value (is competitive position strengthening). Each layer builds on the previous one. Attribution requires controlled experiments — A/B testing, holdout groups, and before-after comparisons with documented baselines.
What is the difference between AI leaders and laggards?
BCG’s 2025 research found that the top 5 percent of companies (“future-built”) show 1.7x revenue growth, 3.6x TSR, 2.7x return on invested capital, and 1.6x EBIT margin compared to laggards. Leaders deploy 62 percent of initiatives to production (versus 12 percent for laggards), achieve 9 to 12 month time-to-impact (versus 12 to 18 months), and concentrate 70 percent of AI value in core business functions rather than scattered experiments.
How do you get CFO buy-in for AI investment?
Present AI investments in business language: cost per outcome (not model accuracy), revenue attribution (not adoption rates), margin impact (not token consumption), and payback period (not technical milestones). Show industry benchmarks that demonstrate competitive risk of underinvestment. Propose phased investment with clear stage gates tied to measurable business outcomes at each phase. Include the cost of inaction — competitive disadvantage, talent attrition, and operational inefficiency.
Should AI ROI be measured per project or enterprise-wide?
Both, at different phases. During pilots and early scaling (Phase 1 and 2), measure per-project ROI to validate business cases and inform investment decisions. As AI scales across functions (Phase 3 and 4), shift to enterprise-wide metrics: AI-driven revenue as a percentage of total revenue, AI-enabled cost savings as a percentage of operating expenses, and comparative AI maturity metrics. The transition from project-level to enterprise-level measurement signals organizational AI maturity.
How does agentic AI change the ROI equation?
Agentic AI — autonomous systems that execute multi-step workflows — is projected to grow from 17 percent of total AI value in 2025 to 29 percent by 2028, according to BCG. It changes the ROI equation because agents generate compound returns: they operate continuously, handle increasing task complexity, and improve with each cycle. Organizations deploying agents report higher ROI than those using AI only for assisted tasks. However, agents also require higher governance investment and more sophisticated measurement — making the total cost of ownership more complex to calculate. Forward-thinking companies already allocate 15 percent of AI budgets specifically to agentic systems.
What role does data quality play in AI ROI?
Data quality is the single biggest determinant of AI ROI ceiling. Organizations with clean, integrated, governed data achieve measurably higher returns from every AI initiative. Those with fragmented, low-quality, siloed data struggle regardless of model sophistication. McKinsey and BCG both identify data strategy as a precondition for AI value. If your AI initiative is underperforming, the first place to investigate is not the model — it is the data feeding the model.
Conclusion
The AI ROI conversation in 2026 has reached an inflection point. The era of faith-based AI investment — where adoption metrics substituted for business outcomes and impressive demos justified continued spending — is ending. In its place, a new discipline is emerging: rigorous, continuous, multi-layered measurement that connects AI activity to financial impact with the same precision that organizations apply to every other major investment.
The data is unambiguous. Five percent of companies capture the vast majority of AI value. They do so not through superior technology but through superior alignment, superior measurement, and superior execution discipline. They baseline before they deploy. They measure outcomes, not activity. They redesign workflows instead of layering AI on broken processes. And they scale deliberately — from pilot to function to enterprise — with clear evidence at each stage that the investment is working.
The other 95 percent are not necessarily failing. Many are simply measuring the wrong things, scaling too slowly, or operating without the organizational infrastructure that AI requires to deliver returns.
At Trantor, we help enterprises close this gap. From AI strategy and implementation to data engineering, workflow redesign, and the measurement infrastructure that proves value at every stage, we partner with organizations to turn AI investment into AI returns. Because the question every board is now asking — “What is the ROI on our AI investment?” — deserves an answer backed by data, not anecdote. And the organizations that can answer it will be the ones that continue to invest, scale, and lead.