CSaaS, zBlog
Top 10 Customer Success Metrics That Matter for Customer Experience
atif | Updated: October 9, 2023
Introduction
In today’s digital landscape, the customer experience is everything. With endless options at their fingertips, modern buyers have high expectations for their interactions with brands. If a company fails to deliver an exceptional experience throughout the customer journey, customers will simply take their business elsewhere.
That’s why forward-thinking companies are investing heavily in customer success. But how can you know if your customer success strategies are working? The key is tracking and optimizing the right metrics.
In this comprehensive guide, we’ll explore the most valuable customer success metrics you should be monitoring in 2023 and beyond. You’ll uncover industry research on the business impact of customer success, learn how to calculate key metrics and gain actionable tips to improve each one. Follow along for thought leadership that will help you boost loyalty, reduce churn, and unlock revenue growth.
Why Customer Success Matters More Than Ever
Let’s start with some context on why customer success has become mission-critical. Here are key statistics that demonstrate the immense value of getting customer success right:
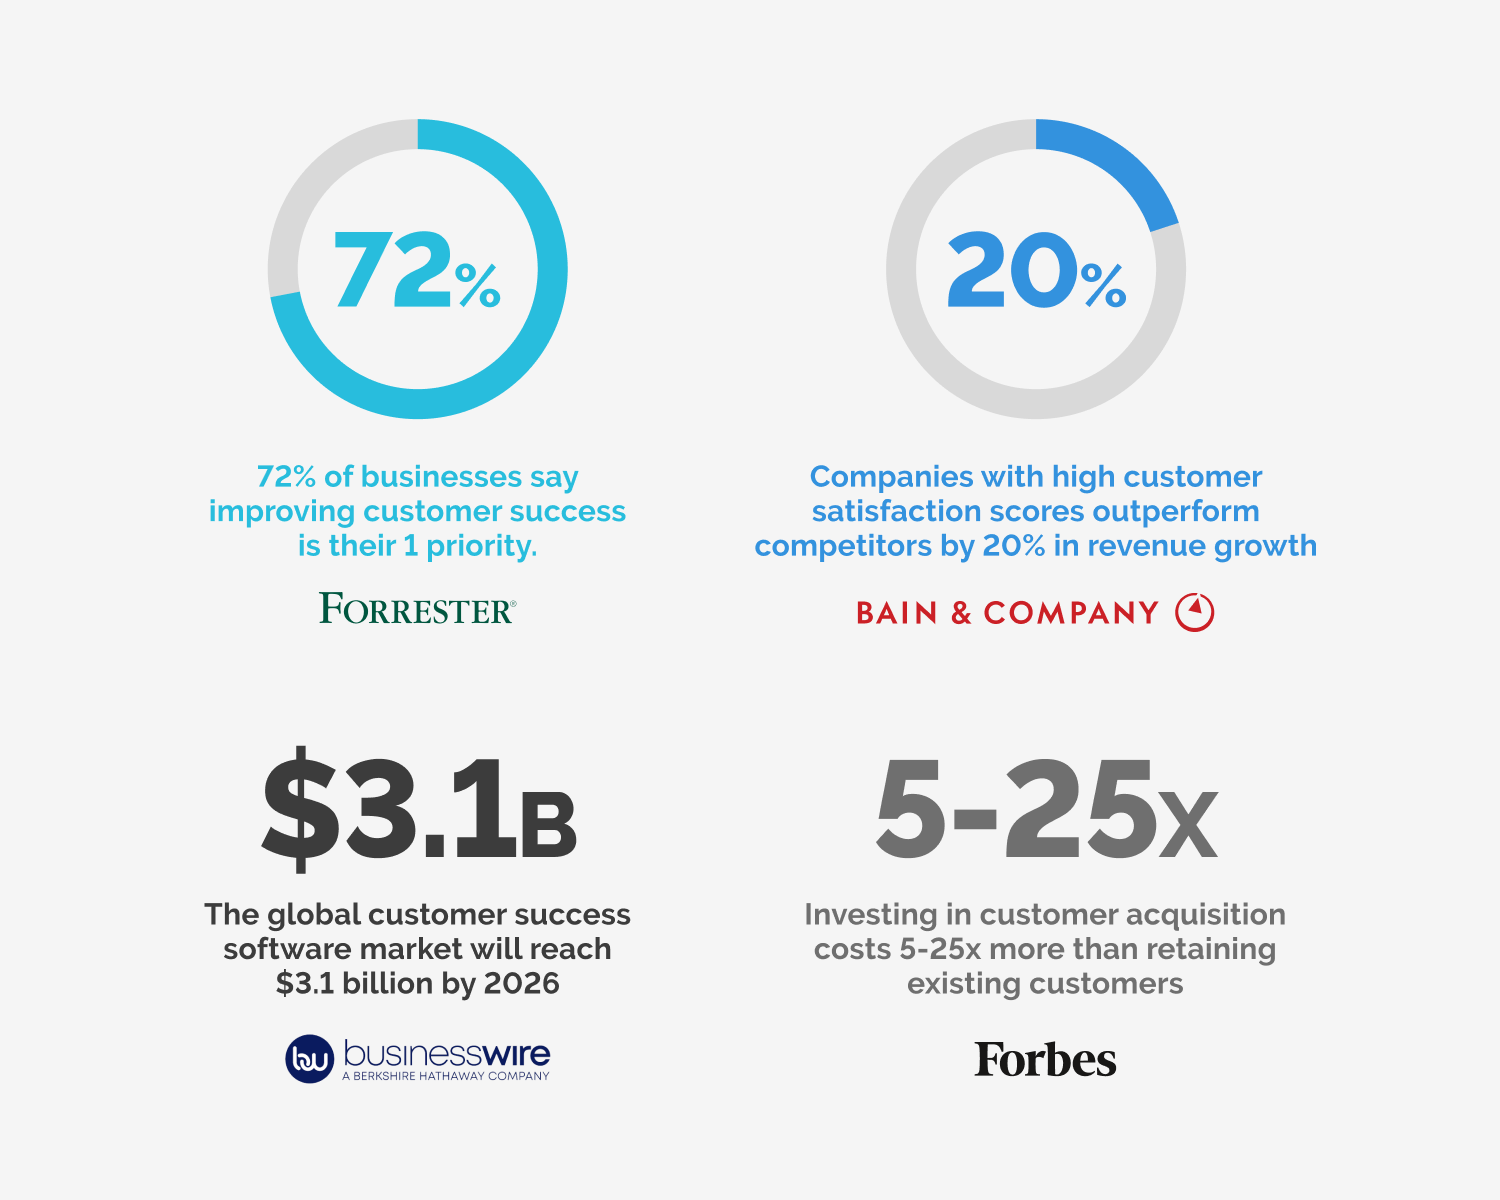
As these stats reveal, customer success has become intrinsically linked to the bottom line. Forrester finds that customer obsession pays off, with 72% of businesses reporting it as their main focus.
Plus, loyal customers that stick around spend more over time. It costs far less to retain happy customers than to acquire new ones. As such, investing in customer success is fundamental to sustaining growth.
The proof is in the booming customer success software market, projected to triple within years. More companies are recognizing success doesn’t stop at the point of sale. The real work begins after implementation, as you help customers adopt your product and achieve their desired outcomes.
Now let’s explore the go-to metrics for measuring customer success performance and pinpointing areas for optimization.
10 Critical Customer Success Metrics and How to Improve Them
1. Customer Churn Rate
Customer churn rate measures the percentage of customers who stop using your product or service during a given time. It indicates customer dissatisfaction as well as loss of revenue. Reducing churn is a primary goal of customer success.
- Industry Average: 8-10% monthly churn is the average for SaaS businesses. But top performers maintain churn under 5%.
- How to Calculate: Churn rate formula: Number of customers lost ÷ Total number of customers = Churn rate
- How to Improve: Identify customers at high risk of churn based on behavioral data and usage patterns. Address pain points through proactive outreach and education. Offer discounts or free trials to incentivize renewals.
2. Net Promoter Score (NPS)
Net Promoter Score gauges customer loyalty and satisfaction. It’s calculated from direct customer feedback asking their likelihood to recommend your product on a 0-10 scale.
- Industry Average: 33 is an average NPS across industries. However successful SaaS companies often score above 70.
- How to Calculate: % Promoters (scores 9-10) – % Detractors (scores 0-6) = NPS
- How to Improve: Survey customers post-purchase, after onboarding, and periodically. Review feedback and take action to improve weak areas. Train staff in customer-focused service.
3. Customer Lifetime Value (CLV)
Customer lifetime value is a prediction of total revenue from a customer throughout your entire relationship. It demonstrates the financial impact of customer retention programs.
- Industry Average: For SaaS, CLV between 3-7x the annual contract value is healthy. Top performers maintain CLV above 10x.
- How to Calculate: Average Purchase Value x Purchase Frequency x Customer Lifespan = CLV
- How to Improve: Offer add-ons and expanded packages. Upsell customers to premium plans. Develop loyalty programs to drive repeat purchases. Extend customer lifespans through education and engagement.
4. Monthly Recurring Revenue (MRR)
Monthly recurring revenue is the total subscription revenue recognized each month. MRR growth is a key metric for SaaS & subscription businesses to monitor the health of sales.
- Industry Average: 10-15%+ MRR growth per month is a strong benchmark for SaaS startups. More mature companies aim for 5-10% MRR growth.
- How to Calculate: Sum of monthly subscriptions from all existing customers
- How to Improve: Structure pricing plans to optimize recurring revenue. Incentivize customers to upgrade subscriptions. Limit service downgrades. Ensure customers are adopting features that drive product value.
5. Customer Effort Score (CES)
The customer effort score measures the ease of getting support. It’s vital for reducing friction in the customer journey and providing seamless self-service options.
- Industry Average: Top brands score 80-90%. Anything under 70% indicates customers are expending high effort.
- How to Calculate: % customers rating ease of getting support high on a scale
- How to Improve: Streamline help options. Implement faster response times. Upgrade knowledge bases & self-service. Ensure resources match customer questions. Listen to feedback to identify pain points.
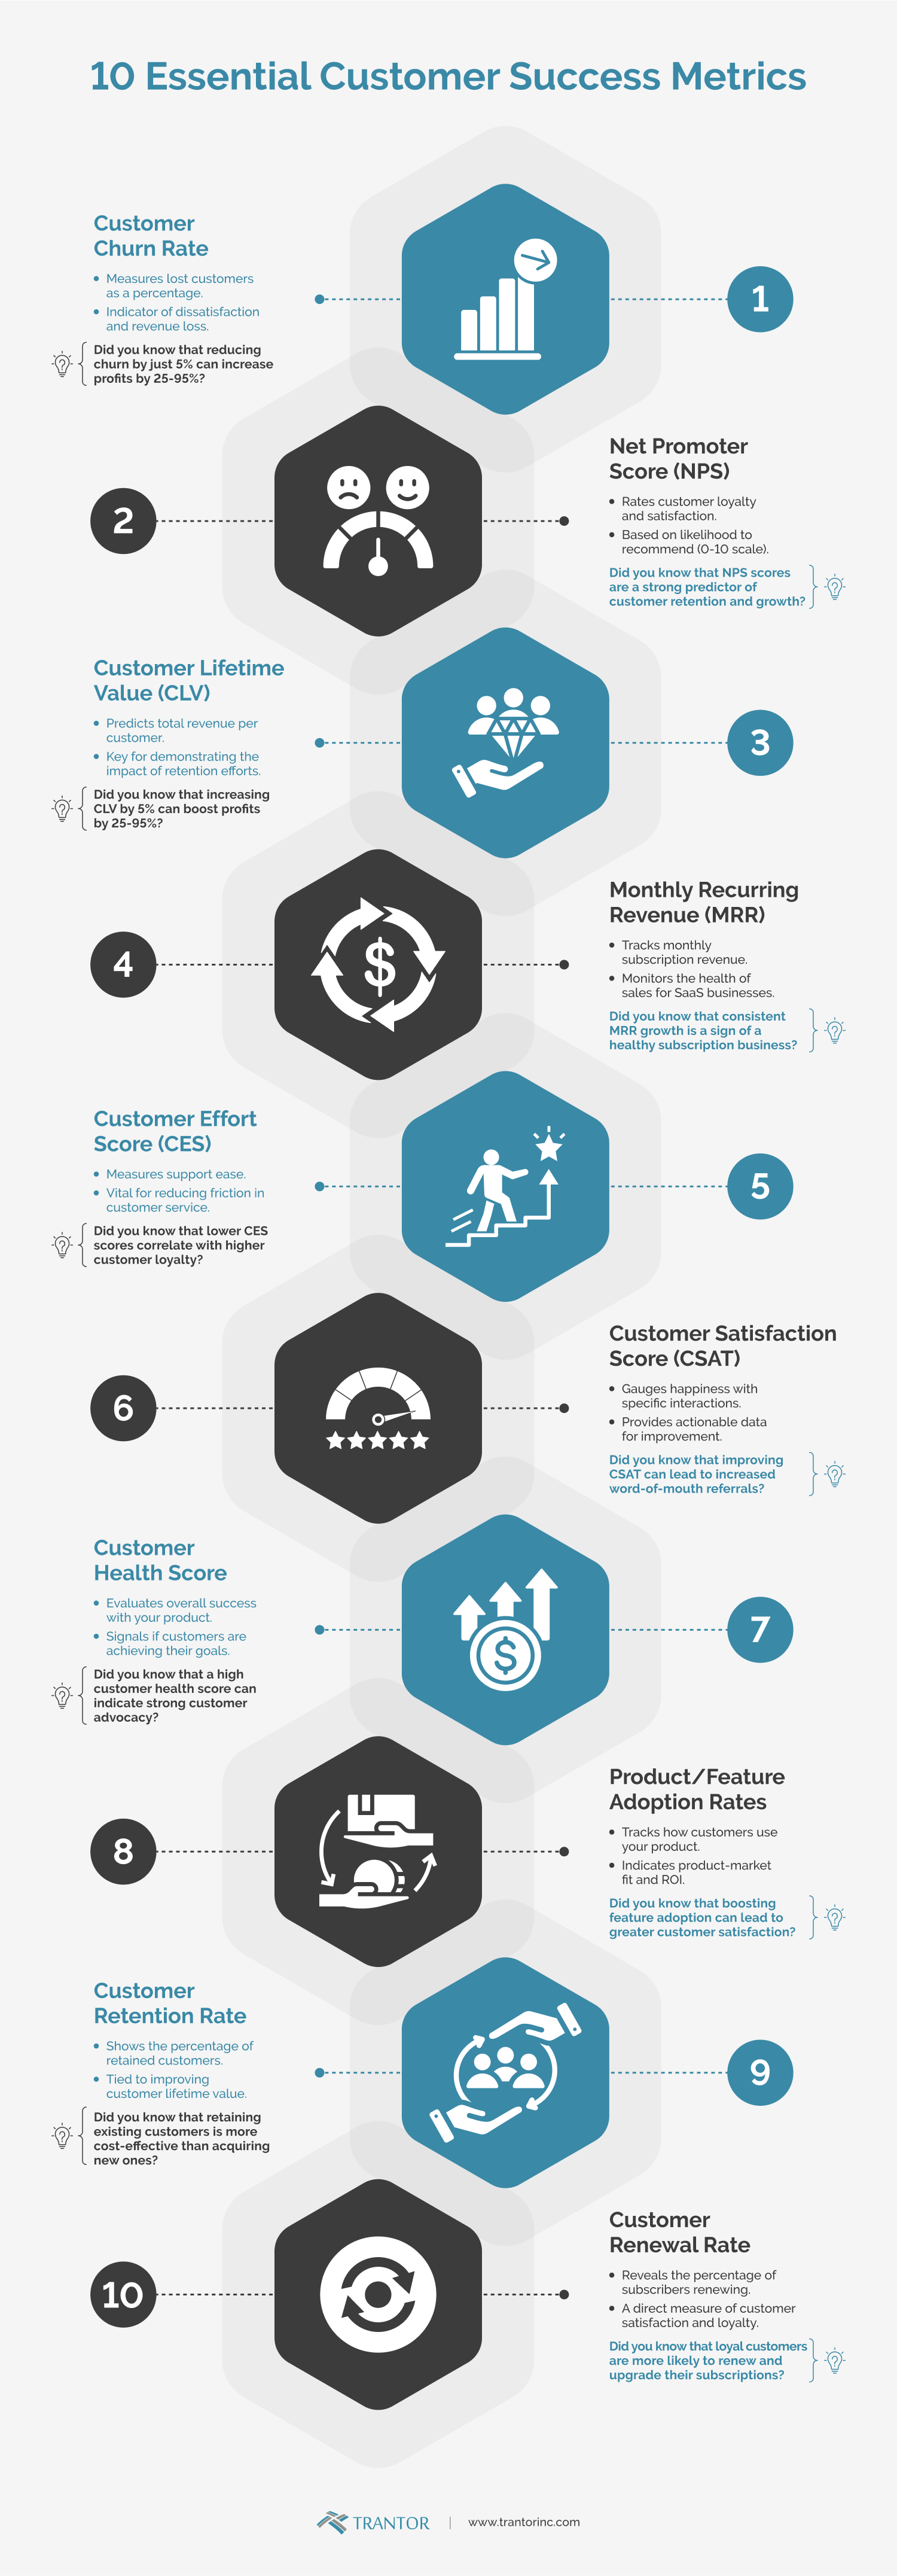
6. Customer Satisfaction Score (CSAT)
Customer satisfaction score gauges happiness with a specific interaction, such as purchases, support cases, or feature usage. It provides actionable data to improve weak points.
- Industry Average: Good CSAT is over 80%. The best companies maintain CSAT above 90%.
- How to Calculate: % happy customers from surveys after touchpoints
- How to Improve: Gather context behind low scores. Identify common pain points. Improve processes, staff training, and communication around identified weak points. Celebrate and replicate high-scoring areas.
7. Customer Health Score
Customer health score evaluates overall success and outcomes achieved using your product. It signals whether customers are getting ROI and reaching goals.
- Industry Average: There’s no single benchmark, as metrics vary. But 80%+ is a good goal for core progress indicators.
- How to Calculate: % of customers meeting defined health criteria based on behaviors
- How to Improve: Set standard health indicators per product, such as feature usage, work completed, and goal progress. Monitor at-risk customers. Offer training and support to optimize adoption.
8. Product/Feature Adoption Rates
Adoption rates track how customers use and engage with your product. High adoption indicates you’re delivering ROI, while low adoption signals poor product-market fit.
- Industry Average: A general goal is 60-70% feature adoption. Business software products average around 29% adoption.
- How to Calculate: % of users that adopted a feature over time
- How to Improve: Prioritize features based on value. Simplify user onboarding. Offer training. Highlight adoption leaders. Incentivize usage through promotions or challenges.
9. Customer Retention Rate
Retention rate shows the percentage of customers retained over a period of time. As retention improves, so does customer lifetime value.
- Industry Average: 65-75% annual retention is average, but SaaS leaders retain 80-90%+ annually.
- How to Calculate: Total customers at end of time period ÷ Total customers at start = Retention rate
- How to Improve: Identify customers at risk of churn. Resolve pain points through surveys and outreach. Offer loyalty perks and discounts. Roll out new features based on feedback.
10. Customer Renewal Rate
Renewal rate reveals what percentage of subscribers renew contracts after the term ends. It’s a direct measurement of customer satisfaction and loyalty.
- Industry Average: 60-80% subscription renewal rates are common, but the best SaaS companies exceed 85%.
- How to Calculate: Total renewals ÷ Total renewals + cancellations = Renewal rate
- How to Improve: Build loyalty programs to encourage renewals. Offer perks for long-term subscribers. Proactively communicate renewal options. Resolve common reasons for cancellations, like cost and churn.

How Top Companies Use Customer Success Metrics to Accelerate Growth
Leading companies recognize customer success metrics reveal opportunities to improve experiences, reduce churn, and drive growth. Here are examples of how top brands expertly track and act on metrics:
- Microsoft
The technology giant built their customer success platform called Microsoft Dynamics 365 to gain greater insights into customer outcomes. By integrating workflows across sales, service, and marketing teams, they enable seamless hand-offs and visibility into the entire lifecycle. Real-time analytics help them measure adoption, satisfaction, and advocacy to proactively optimize the customer journey. - Square
The payments processor tracks metrics like product adoption and usage to optimize their merchant solutions. Low feature adoption led them to discover sellers struggled to onboard alone. By responding with guided onboarding flows, Square increased adoption by 23% within a year. They also analyze NPS feedback and CSAT scores to identify evolving merchant needs. Enabling merchants to easily track sales metrics themselves has been one improvement driven by customer feedback. - Peloton
The home fitness company closely monitors engagement metrics to retain its loyal community of members. Peloton motivation features like live leaderboards, challenges, and social tools spur engagement. Customer support teams monitor participation in these gamified features to deliver personalized outreach to inactive users. Their branded community and two-way dialogue also allow them to stay on top of customer feedback. This member-centric approach leads to sky-high NPS scores above 80 and extremely low churn under 1%.
Takeaways
As these examples demonstrate, savvy use of customer success metrics allows companies to:
- Pinpoint adoption issues blocking ROI
- Identify at-risk customers for retention campaigns
- Surface evolution needs to guide product roadmaps
- Measure the effectiveness of onboarding and support
- Quantify the revenue impact of loyalty programs
- Benchmark performance over time
While metrics offer crucial signals, acting on the insights is what drives real results. Monitoring is only step one—the value comes from listening to data to implement customer-focused solutions.
Key Recommendations for Success with Customer Metrics

Ready to elevate your customer success analytics? Here are best practices to effectively monitor, analyze, and optimize your metrics:
- Select a focused set of metrics – Avoid tracking too many metrics that lead to confusing signals. Identify the 5-7 KPIs most aligned to your goals.
- Measure consistently – Use the same metrics definitions and calculations over time. Standardization provides reliable trend analysis.
- Automate tracking – Use tools that automatically capture and visualize your metrics for real-time monitoring.
- Leverage customer feedback – Metrics alone don’t provide context. Survey customers for insights into low scores.
- Segment users – Filter metrics by customer personas, usage levels, locations, and other variables to uncover hidden patterns.
- Set targets – Establish your benchmark goals based on industry research and past performance.
- Review regularly – Analyze metrics frequently, at least monthly. A speedy response to changes is key.
- Take action – Metrics give you direction—now execute changes to move numbers. Progress requires decisive action.
- Optimize over time – Expect metric improvements to take time after changes roll out. Stay patient and persistent.
With these best practices guiding your customer success analytics, you’ll be well-equipped to track performance, identify opportunities, and implement data-backed improvements.
Redefining Customer Success

At Trantor, we are redefining customer success through our specialized services and proven approach. Our customer-centric model focuses on accelerating time-to-value, improving experiences, increasing efficiency, and unlocking revenue growth for clients.
We help companies enhance customer experience, reduce churn, and strengthen engagement. Our customer success teams concentrate on fast onboarding, deep product adoption, maximum customer engagement, and ongoing support.
- Fast, Seamless Onboarding
Trantor’s onboarding expertise enables rapid product adoption and integration into customer workflows. We accelerate time-to-value by ensuring customers can quickly leverage our client’s solutions to meet their business needs. Our onboarding processes are engineered for speed and simplicity from the outset. - Driving Product Adoption
Deep product adoption is core to our customer success approach. Trantor drives maximum usage and ROI by ensuring customers fully utilize the key capabilities of our client’s products. We proactively engage users to promote feature awareness, provide training, and highlight successes. This adoption focus delivers the full value of the solutions to each customer. - Fostering Lasting Relationships
Trantor fosters strong customer relationships through consistent outreach, education, and addressing evolving needs. Our success teams build connections through proactive touchpoints and add value at every interaction. We aim to establish trust and loyalty as a true partner invested in mutual success. - Seamless Support Experience
Our tech-enabled support model provides effortless self-service alongside high-touch account management as needed. Customers appreciate our resolution-focused approach at every tier, rather than just escalating through levels. We map and optimize the entire journey to make getting help fast, simple, and effective.
The Trantor Difference
Several key differentiators set Trantor’s approach apart:
- We keep customers engaged with deep product expertise to drive adoption, satisfaction, and referrals.
- Our teams establish trust by demonstrating relevance, ROI, insights, and commitment for the long term.
- Trantor boosts revenue growth by ensuring successful outcomes that lead to renewals, expansions, and new purchases.
- Our integrated delivery model enhances operational efficiency for predictable results.
While metrics offer crucial signals, acting on the insights is what drives real results. Monitoring is only step one—the value comes from listening to data to implement customer-focused solutions.
Results that Speak Volumes
Trantor’s customer-driven model consistently delivers impressive results:
- 92% customer retention rate
- 95%+ contract renewal rates
- 5X increase in product adoption
- 50+ Net Promoter Score
Let’s connect to discuss how Trantor can redefine success for your business and customers.
